Glucose syrups and their related products (e.g. dextrose, maltodextrins) are composed of a theoretically infinite mixture of saccharides based on D-glucose (dextrose), together on occasions with fructose. In the case of sugar alcohols, these saccharides are hydrogenated. As well as the major carbohydrate constituents, there are trace contents of inorganic salts and nitrogenous compounds, and other trace organic compounds, e.g. acids.
As well as the chemical constituents, and in many cases related to them, there is a range of physical properties which are measured, to both monitor and control the production process. These properties are also important in the application of these starch hydrolysis products in formulated foodstuffs.
Particularly in the case of monitoring and controlling production processes, but also useful for other applications, the availability of rapid and reliable methods of analysis is desirable. Developments in the last decade have essentially been in methods of analysis that are more rapid than those which have been replaced.
Analysis of glucose syrups
Analysis of glucose syrups is divided into two main articles. This article describes mainly the measurement of the physical properties and minor constituents of starch hydrolysis products. Many of these methods have been in use for a number of decades, although there are also some where recent developments have led to more rapid results being attained. This article also includes the use of enzymatic methods for the determination of individual sugars.
The other article: “Determinations using chromatographic methods” is devoted to the determination of the saccharide constituents of the products, largely by the application of chromatographic methods.
Traditional physical and chemical analyses
Dry substance
The determination of dry substance is an important property of a glucose syrup from the point of view of both the producer and the user of the syrup. The methods which are, or have been, used are many and various, but those covered here are the methods most commonly in use today.
Refractive index
The concentration of a pure substance dissolved in water is proportional to its refractive index when measured at a specific temperature. In the sugar industry this relationship has been used for many years to measure the solids content of sugar solutions, and refractometers are frequently calibrated with both refractive index and sucrose solids (o Brix).
Glucose syrups are not solutions of single substances and this term covers starch hydrolysis products with a wide range of constituent saccharide contents. Frequently inorganic ions from both the original starch source and those introduced during processing are also present. It is therefore necessary to know the composition of the syrup before the refractive index can be used to determine the dry substance of a syrup.
Notwithstanding this apparent drawback, refractive index is the most commonly used method in the industry for determining the solids content of glucose syrups of known composition. This use is due to its speed and ease of measurement. Sets of tables have been published for converting measured refractive index to dry solids content for a wide range of saccharide compositions, including fructose, and also with ash corrections (CRA, 1975; Wartman et aI., 1976; ISO, 1982). The utility and accuracy of the method has also been improved with the derivation of an equation, which is available in a computer software program. This produces a refractive index/solids table for any combination of sugars and trace inorganics content (CRA, 1993).
Measurement is made using a refractometer calibrated with indices from 1.3 to at least 1.6 and accurate to 0.0001 unit. The prism is usually maintained at 45°C ± 0.5°C with circulating water, in order to prevent the crystallization of high dextrose syrups and ease the handling of viscous, high solids syrups. Expression of the result at 20°C, obtained from tables, is also frequently carried out. In practice, a small amount of the sample is introduced onto the prism face of the instrument, which is then immediately closed to prevent evaporation. On achieving temperature equilibrium the reading is noted and the dry substance is obtained from the appropriate table.
Oven drying
Results obtained from loss in weight on drying will be affected by one or both of the following factors:
- The extent of loss of water and other volatiles from the sample.
- Production of water and other volatiles by chemical changes induced by the condition of drying. This, in theory at least, can partially be offset by an increase in weight due to reactions between the substance and oxygen or other environmental substances.
Oven drying methods must therefore be a compromise of the conditions such that the release of water vapor is maximized and the occurrence of chemical reactions is minimized. The method given below is a recognized standard (ISO, 1980; CRA, 1989a), but it should be stressed that in order to achieve reproducible results it is essential that details of the method are obtained from the original source and are strictly adhered to. There is also a degree of controversy about the applicability of oven drying methods to glucose syrups, and for that reason, it is nowadays not commonly used.
The method utilizes quartz sand or diatomaceous earth as an adsorbent for the diluted sample. These are mixed together in a lidded aluminum moisture dish with a small glass rod and all are weighed. This is dried to constant weight at 100°C in a vacuum oven, the sample being stirred with the glass rod to break up any lumps after about 5 h, before being placed back in the oven.
Moisture by Karl Fischer titration
This method is based on chemical reactions which are reasonably specific for water, although some other compounds may interfere. In principle the method depends upon the water in the sample being taken up by a solvent containing methanol and formamide, the excess then being reacted with iodine in the titrant (CRA, 1992; ISO, 1983; MacLeod, 1991).
It is usual for commercially available instrumentation to be used nowadays, together with modified reagents which obviate the need for the noxious pyridine originally used. The endpoint may be detected visually, but it is more usual to determine it electronically. The reagents are standardized against a standard solution of water in methanol, or a pure salt hydrate such as sodium tartrate dihydrate may be used.
The method has the advantage of producing a direct measure of water content and when in routine use is a relatively rapid method. It does, however, have drawbacks in that, to obtain accurate and consistent results, great care must be exercised in order to prevent the ingress of extraneous moisture at any stage.
Specific gravity/density
The use of hydrometers calibrated to the Baume scale was a common method, originating in the USA, of indirectly determining the solids content of glucose syrups. If the DE of the syrup is known, tables are available for converting the Baume to solids (CRA, 1959). In order to overcome the effects of high viscosity and entrapped air, the specific gravity is determined at elevated temperature (usually 140oF) to ensure consistent results. An arbitrary 1.0° Baumé correction factor is added to reduce the value to that which would be obtained at 100oF. The method is rarely used nowadays other than for manufacturing process control, and rather than hydrometers, in-line density meters are more generally employed (e.g. utilizing the principle of absorption of ionized radiation).
Dextrose equivalent (DE)
The definition of dextrose equivalent is ‘the reducing sugar content expressed as dextrose percentage on dry matter’, using a standard method for the determination of reducing sugars. By this definition pure starch has zero DE, whilst dextrose (D-glucose) has a DE of 100. The DE of a starch hydrolysate is therefore an indication of the degree of hydrolysis of the starch, although, with the advent of enzymatically hydrolyzed syrups containing sugars other than dextrose as the predominant sugar, the relationship is no longer as meaningful, as syrups of very different composition can have the same DE.
Lane-Eynon titration
The standard method for the determination of DE relies on the reducing power of the carbohydrate, which reduces copper sulfate in an alkaline tartrate solution. The method used is the constant volume Lane and Eynon method (eRA, 1968), which will not be detailed here. Suffice it to say that accurate and reproducible results are only obtained by strict adherence to the detail of the method, such as boiling time, total elapsed time, and volume of sample titrant. In experienced hands and with samples of known approximate DE it is a rapid and accurate method.
Osmometry
The determination of DE or degree of hydrolysis is, in effect, a determination of the average number molecular weight of starch hydrolysate. The colligative properties are therefore directly related to DE, and this fact is made use of by the determination of DE from the depression of the freezing point, using an osmometer (Kearsley, 1978). This is a method that has become increasingly commonly utilized for process control, due to its speed, although a correction for ash content has to be applied. The depression of the freezing point of a solution of the saccharide sample is accurately determined by the use of a programmable, commercial osmometer, and the DE is read off from a calibration graph prepared using samples of known DE by Lane-Eynon titration (Fitton, 1979).
Sugars determination by enzymic methods
The specificity of enzyme induced reactions provides a very interesting extra dimension for the measurement of sugars. Glucose, in particular, lends itself readily to enzyme based procedures. There are two approaches that form the basis of this analytical concept. One protocol utilizes the action of glucose oxidase (GOD) on glucose to produce gluconic acid and hydrogen peroxide. Only β-D-glucose is involved, so it is imperative that the sample is at the equilibrium point (67:33, β:α) for glucose in solution. The hydrogen peroxide produced, in the presence of peroxidase, will then induce a change in the chromophore of a colored substance which is measured spectrophotometrically. A suitable reagent for this is 2,2-azino-di-[3-ethylbenzthiazoline sulphonate (6)], commonly known as ABTS, which produces a green color (AFNOR, 1986). Another suitable reagent is 4-aminoantipyrine (Megazyme, 1992) which yields a red colour.
An original approach has also been developed, by using a cell containing a membrane with immobilized glucose oxidase (Y.S.I., 1979). When the sample is injected, glucose passes through the membrane where it reacts with GOD to produce hydrogen peroxide. This, in turn, traverses to a platinum anode where it is oxidized. The current flow produced is linearly proportional to the local concentration of hydrogen peroxide at the equilibrium point of the reaction and this makes the system a very fast means of quantifying glucose. In the industry this is used for process monitoring; correlation against HPLC is very good. This approach is limited by the availability of different oxidases and as yet no suitable method exists for fructose.
A second protocol uses the reduction of nicotinamide adenine dinucleotide phosphate (NADP) as the final measurement step. The change in concentration of NADPH can be measured spectrophotometrically in the UV waveband. Both glucose and fructose undergo phosphorylation by adenosine-5-triphosphate (ATP) when catalyzed with hexokinase (HK). The glucose-6-phosphate (G-6-P) formed is oxidized by NADP with the formation of NADPH which is stoichiometric with the amount of D-glucose. To determine fructose the fructose-6-phosphate (F-6-P) formed in the first step must be isomerized to G-6-P, and then the same determination made as for glucose. This explanation is simplified and the concept has been fully exploited by Boehringer, who sells kits for several sugars. Many of the procedures rely on the transformation of the original sugar (e.g. maltose, saccharose) to yield glucose initially.
Both enzymic approaches have advantages and disadvantages. Using a colorimetric measurement for the glucose requires calibration and certain steps of the total analysis may not necessarily be specific. There is no doubt about the specificity of the HK approach. All methods are extremely sensitive, which may mean working with very dilute solutions and small volumes. This is especially so for the Boehringer protocol. All the reactions take place in the cuvette of the spectrophotometer and often sample size is 0.1 ml. Our own experience shows that if this aliquot can be increased to the maximum possible (2 ml), repeatability is greatly improved. None of the commercial kits appears to have been properly validated with regard to tolerance of the method. The enzymic methods should be viewed as complementing chromatographic methods.
Acidity
There is a small residual acidity in glucose syrups, due to trace amounts of organic acids and buffer salts produced from them with inorganic cations. With ion exchanged glucose syrups this acidity is of little significance, but it is still determined for a few applications. There is a standard method agreed within the industry (CRA, 1983), whereby a 40% w/w solution of the sample is titrated with 0.05 M sodium hydroxide solution to a pH 6.0 end point. The result is expressed in meq g-1.
Ash
Ash present in glucose syrups originates from both the starch source and also from any acid treatment of the starch, or pH adjustments, during hydrolysis and refining. As mentioned earlier, it is now common practice to ion exchange refined glucose syrups, so residual ash contents are normally very low.
It is usual to determine sulfated ash in glucose syrup. This aids in the decomposition of the organic matter in the early stages of the ashing process and leads to more consistent ash. Standard methods of sulfated ash determination are used (CRA, 1985; ISO, 1994), the initial charring with acid taking place in a silica dish on a hotplate or over a Bunsen flame in a fume cupboard. Care has to be taken initially to prevent loss of sample due to foaming. The dish is then placed in a muffle furnace at 550°C until constant weight is achieved. Sulfated ash is sometimes converted to ‘true’ ash by multiplying by the factor 0.85.
Inorganic ions
As ion exchanged glucose syrups contain such low contents of inorganic ions it is now generally not necessary to determine any ions in a frequent, routine manner, although there are still a few applications where this may be needed. The individual ions determined by chemical means, in this context, are calcium and chloride, but the advent of ion exchange chromatography has enabled the determination of a wider range of both anions and cations at very low levels.
Calcium
The level of calcium in glucose syrups is critical in some applications, e.g. in a positive context in systems where the gelling of hydrocolloids is determined by the content of calcium ions, and in a negative context where calcium ions may be associated with the occurrence of haze development. The standard method used (CRA, 1973) consists of ashing the sample with sulphuric acid to destroy the organic matter. The residue is dissolved in dilute acid, and potassium hydroxide and triethanolamine are added to prevent interference by iron, magnesium and other cations. The solution is titrated with ethylene glycol tetraacetic acid (EGT A), using hydroxynaphthyl blue indicator for determination of the endpoint. Titration with EDT A is also possible.
Chlorides
The chloride content of a sample is determined by titration with a standard silver nitrate solution, using potassium chromate as an indicator (CRA, 1990a). Alternatively, the end point may be detected by the use of a silver-silver chloride electrode.
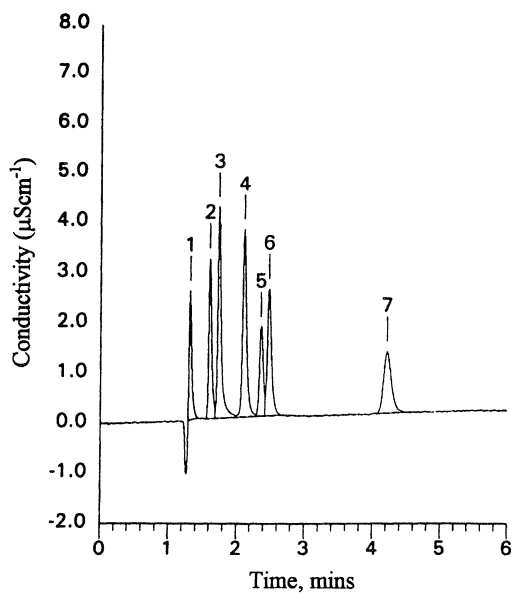
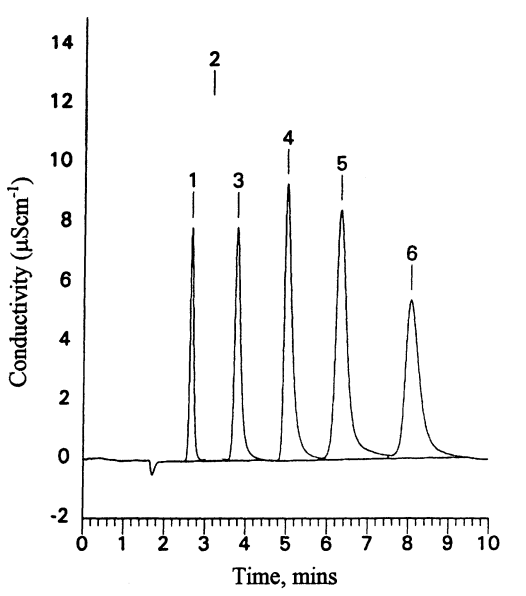
Ion chromatography
This topic is dealt with in more detail in Determinations using chromatographic methods, where its application in relation to the determination of individual saccharides and oligosaccharides is covered. The technique was developed first however for the determination of inorganic ions, and the Dionex™ system in particular is widely used for this purpose.
Ion chromatography columns are packed with resin beads with a pellicular ion-exchange surface coating. These coatings carry a tertiary amine function in the case of anion resins and a sulphonic acid function in the cation resins. The eluents generally used for ion exchange chromatography are sodium hydroxide (typically 1-100 mM) and methanesulphonic acid (typically 20 mM) respectively for anion and cation analysis. Isocratic elution is most commonly used, but gradient elution can be used to decrease the retention time of more strongly retained ions.
Suppression is used in order to reduce the eluent background and increase the conductance of the sample components, by conversion to the acid or hydroxide forms. Suppressors consists of a derivatised microporous membrane. These membranes have exchange sites for ions having a charge opposite to that of the analyte.
Suppression comes in two forms, chemical suppression, and auto suppression. Chemical suppression uses a chemical solution to provide the hydrogen and hydroxide ions required, while auto suppression applies a current to the suppressed eluent (or water), causing it to dissociate and provide these ions.
The most commonly used detection system for ion chromatography is the conductivity detector. More sophisticated detectors are available, such as pulsed amperometric detection, but these are more relevant to other analyses using ion chromatography, such as for carbohydrates. Test chromatograms of standard anion and cation mixtures are shown in Figures 4.1 and 4.2.
Color
The determinations of color and color stability of glucose syrups are critical parameters for both producers and users of the syrups. Reactions between reducing sugars and residual nitrogenous compounds can lead to the formation of color bodies. The type and efficiency of syrup refining, therefore, has a major impact on the stability of a syrup to color development at elevated storage or processing temperatures.
The standard method for the determination of color (eRA, 1989b) is the spectrophotometric determination of light absorbance at 450 nm. The effect of light scattering due to haze is corrected for by subtracting the absorbance at 600 nm. Due to the low color absorbance of most glucose syrups, a cell length of at least 4 cm is required, with in some cases 10 cm being preferred, but results are corrected back to a 1 cm cell.
The presence of air bubbles, which in viscous syrups is difficult to avoid, has a negative influence on the accuracy of the method and for this reason the industry frequently uses a visual comparison method. In this method the color of the sample in a color comparison tube is visually matched with commercially available standard glasses (e.g. Lovibond yellow and red glasses) in a color comparator. This reading (the sum of the Y and R glasses) is converted to optical density using AOCS tables (CRA, 1990b). In all cases of syrup color determination, if a diluted sample is used the result is converted to an arbitrary 80% solids by the use of the relevant dilution factor.
Becoming more popular for measuring the color of syrups are tristimulus instruments. These try to quantify the three color response mechanisms of the human eye. The tristimulus values obtained are the basis for uniform color scales (L, a, b), which are based on the opponent colors theory. The experiment shows that a good correlation can be established between Lovibond values and the b dimension, which is associated with the yellow to blue response. An advantage of this approach is that the b value is little affected by haze or air bubbles.
For determination of color stability (or heat color), the sample of syrup at finished solids is maintained at 100°C for a time of between 1 h and 18 h, depending on the syrup type and application. The color after cooling is then measured as above.
Conductivity and pH
With the general availability of ion exchanged glucose syrups and related products, the determination of pH is more difficult and less meaningful. For this reason the determination of conductivity is often more meaningful. There is not a finalized standard method within the industry, so concentration and temperature may vary, both of which have a significant effect on the values obtained. Values of 30% solids and 25oC are fairly common however for these two parameters. Conductivity is determined using a commercial conductivity meter, results being expressed in μS cm-1.
The determination of pH is usually carried out on a 50% w/w solution of the syrup. For samples of low inorganic ion content it is necessary to leave the pH electrode undisturbed in the sample for up to 5 min to allow a stable reading to be achieved. It is also important to ensure that there is good electrical continuity between the sample and the reference electrode (e.g. the ‘frit’ or other junction between the sample and the saturated potassium chloride in the reference electrode can become blocked and lead to false results).
Sulfur dioxide
Glucose syrups produced from maize starch obtained by the wet milling process will contain trace quantities of sulfur dioxide, residual from the steeping process in dilute sulfurous acid solution. Sulfur dioxide is also frequently added to glucose syrups at the final evaporation stage, not primarily to prevent or minimize the growth of microorganisms, but to limit the color development in storage and/or in the processing of the glucose syrup ingredient into the finished foodstuff. A typical example of this is the cooking of sugar (sucrose) and glucose to produce high-boiled sweets. The sulfur dioxide is usually added to the glucose in the form of sodium metabisulphite solution.
The standard method for sulfur dioxide determination is the modified Monier Williams method (CRA, 1991). In this method, sulfur dioxide is removed from the acidified, boiling sample in a stream of nitrogen. The gas stream is then passed through a dilute hydrogen peroxide solution which oxidizes and traps the sulfur dioxide to produce sulphuric acid. This is titrated against a standard sodium hydroxide solution. Alternatively, a gravimetric analysis may be carried out after reacting the sulphuric acid with barium chloride to produce the insoluble sulfate. This latter addition, whilst being very time-consuming, can overcome the problems of interfering organic acids and related substances. An example where this can be a problem is in the case of high fructose-containing samples. Fructose in acidic solution at elevated temperatures is very prone to be converted to 5-hydroxymethylfurfural (HMF), which in turn yields formic acid. Humines (coloured caramel-like products) are also formed, which decompose to volatile acidic substances: These acids will lead to falsely high S02 results being obtained by titration with alkali.
An alternative more rapid method for the determination of sulfur dioxide is the direct titration in an acidified solution with a standard iodine solution (CRA, 1988). Bound sulfur dioxide is first released by treatment of the sample with alkali in an ice-chilled bath. After the subsequent acidification, the titration must be completed rapidly in order to minimize the recombination of the sulfur dioxide.
Nitrogen and protein
Protein determinations play an important part in the process control of most starch separation processes, and the quality control of animal feed co-products. Small residual amounts of nitrogenous compounds also play a critical role in the development of color in glucose syrups and the monitoring of organic nitrogen provides a useful control check. Kjeldahl nitrogen is used for this purpose, but its relatively poor sensitivity does not fit well with the very low levels found in glucose syrups. The use of a total nitrogen analyzer is more suitable for this application, and the principles of this will also be described. Both these methods yield results for nitrogen content and this is usually converted to protein by multiplying by the factor 6.25 for maize and potato products, and by 5.7 for wheat-derived products.
Kjeldahl nitrogen
Samples are first digested in boiling sulphuric acid containing potassium sulfate to raise the boiling point and a catalyst (usually copper selenite). The proteinaceous nitrogen is converted to ammonium sulfate. The digest, after cooling and dilution, is made alkaline and distilled into a standard acid solution. The residual acid is then back titrated with standard alkali, using methyl red indicator. Alternatively, the ammonia can be distilled into a boric acid solution, followed by titration with acid (CRA, 1980). The usual indicator for this method is methyl redlbromocresol green mixed indicator, but the titration is dilution sensitive, and distillate volumes of samples and blanks should be adjusted to constant volume with distilled water prior to titration. This titration is the basis of a number of commercial protein analyzers.
Total nitrogen analyser
One method used in the design of total nitrogen analyzers is based on the catalytic oxidative pyrolysis of the sample and chemiluminescence for detection, and it is sensitive to levels down to approximately 0.01 mg kg-1. The sample is injected into a reaction furnace containing a platinum catalyst along with a stream of oxygen. The furnace is set to a temperature in the range of 800-900°C, depending on the type of sample. Under these conditions nitrogen compounds are pyrolysed to nitric oxide. This gas stream is mixed with a stream of ozone from an ozone generator, under which conditions the following chemical reaction occurs:
NO + O3 -> NO2 + O2 + hv
The luminescence is detected and the signal handled by a data processing unit. The instrument is calibrated with a standard ammonium sulphate solution when being used for aqueous samples such as glucose syrups. An example of a total nitrogen analyser suitable for glucose syrups is the TN-05 produced by the Mitsubishi Kasei Corporation. An alternative detection methodology used in other commercial instruments depends on the reduction of nitric oxide to nitrogen, over a copper catalyst. The content of nitrogen is then determined by a thermal conductivity detector.