Figure 6.4 gives XRD patterns for the nanocomposites based on the (AS-B)/EVOH blend. It is worth noting that the nanocomposites containing organoclay (Cloisite 30B or Cloisite 15A) show featureless XRD patterns, suggesting that organoclay aggregates might have been highly dispersed. On the other hand, the nanocomposite containing MMT has a d001 spacing of 1.3 nm, which is slightly higher than the d001 spacing of MMT (1.1 nm). This is not surprising because there is no attractive interaction expected between AS-B and the surface of MMT.
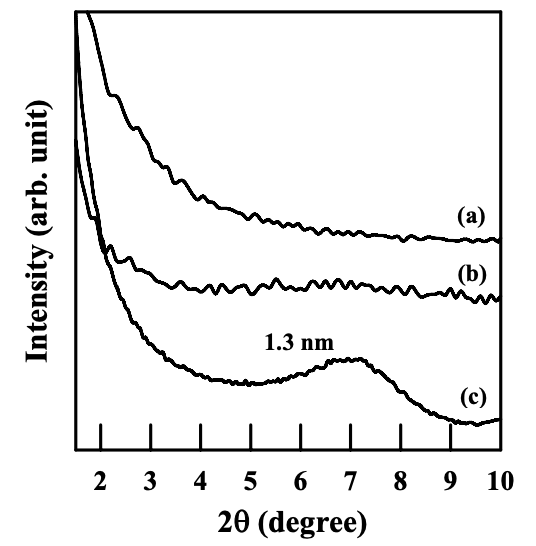
Figure 6.5 shows TEM images for the nanocomposites based on the (AS-B)/EVOH blend, and Cloisite 15A, Cloisite 30B, or MMT. It is clearly seen in Figure 6.5 that both the (AS-B)/EVOH/Cloisite 30B and (AS-B)/EVOH/Cloisite 15A nanocomposite have a very high degree of dispersion of organoclay aggregates in the matrix, whereas the (AS-B)/EVOH/MMT nanocomposite has large MMT aggregates, indicating a poor dispersion of the nanocomposites.
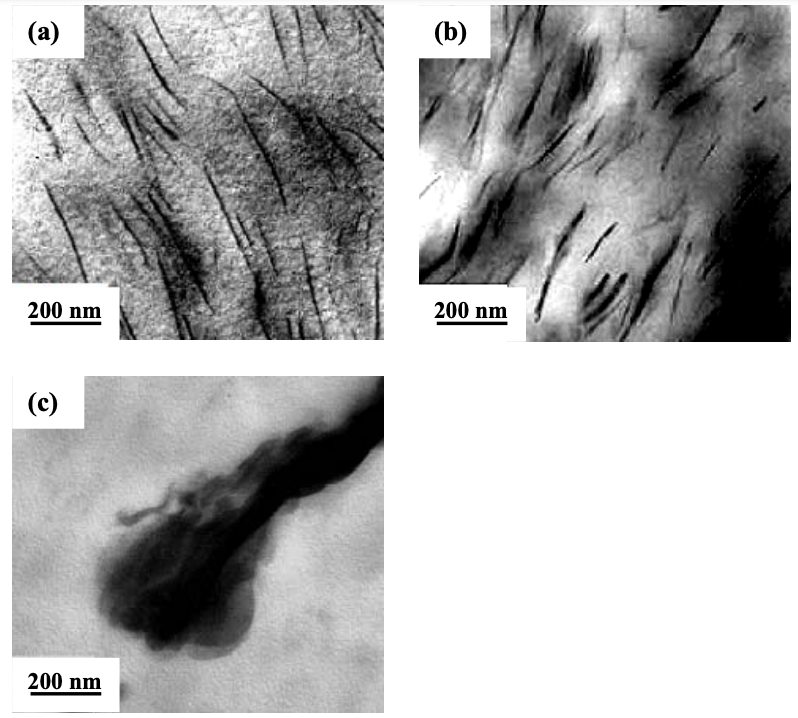
Both XRD patterns and TEM images shown above indicate that both the (AS-B)/ EVOH/Cloisite 30B and (AS-B)/EVOH/Cloisite 15A nanocomposites have a high degree of dispersion of organoclay aggregates, whereas the (AS-B)/EVOH/MMT nanocomposite has a very poor dispersion of MMT aggregates. Note that the surfactant residing at the surface of Cloisite 30B or Cloisite 15A have positively charged N+, and AS-B has anionic functional group −COO−. Thus, the high degree of dispersion of organoclay aggregates (so-called exfoliation of layered silicates) might have resulted from the ionic interaction between N+ at the surface of the organoclay and −COO− in the modified starch. It is well established that the ionic interaction is much stronger, although not as strong as covalent bonding, than the hydrogen bonding.
To directly probe evidence of the ionic interaction between −COO− and N+, FTIR spectroscopy was employed. Figure 6.6 gives the FTIR spectra for (a) (AS-B)/EVOH blend, (b) (AS-B)/EVOH/Cloisite 30B nanocomposite, (c) (AS-B)/EVOH/Cloisite 15A nanocomposite, and (d) (AS-B)/EVOH/MMT nanocomposite.
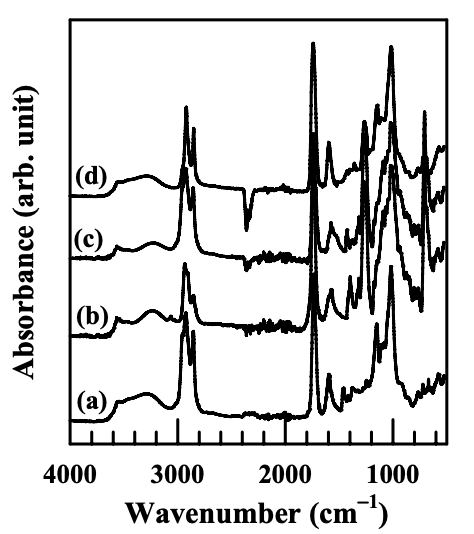
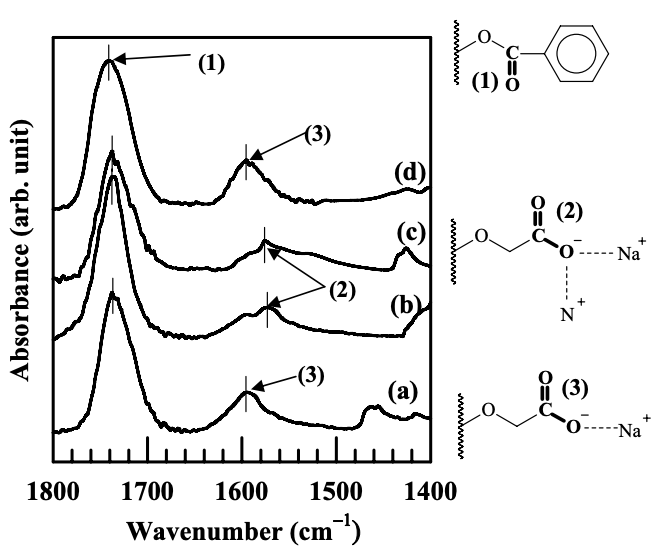
Figure 6.7 gives the carboxyl group stretching region for the same FTIR spectra shown in Figure 6.6. In reference to Figure 6.7, the absorbance band at 1737 cm−1 is attributed to the stretching of carbonyl groups (C=O) in the benzoyl ester group in a modified starch. The absorbance band at 1594 cm−1 in the spectra of the AS-B/EVOH blend is attributed to asymmetric stretching carboxylate group (−COO− ) in the AS-B. It is seen that the absorbance band of carboxylate group is shifted to 1572 cm−1 for the nanocomposites containing a high degree of dispersion of Cloisite 30B or Cloisite 15A aggregates. There is no shift in the absorbance band of carboxylate group for the nanocomposite containing MMT aggregates. Previous studies reported that the absorbance band of carboxylate group was shifted to a lower wavenumber when ionic interactions were present between the carboxylate groups and other positively charged groups. Yano and coworkers reported that in the binary blends of sodium and zinc salt ionomers of poly(ethylene-co-methacrylate) (PEMMA), the absorbance band of asymmetric stretching of carboxylate groups was found at 1569 cm−1 when carboxylate groups bridged sodium and zinc cations. Zha et al. reported that in the preparation of nanocomposites based on synthetic polymers (homopolymer or block polymer) end-functionalized by carboxylate sodium salt, the absorbance band of asymmetric stretching of carboxylate groups was found at 1570 cm−1 because of the ionic interaction between the carboxylate groups and the N+ in the surfactant residing at the surface of Cloisite 30B. Thus, it is reasonable to state that the absorbance band at 1572 cm−1 found in Figure 6.7 is asymmetric stretching of carboxylate group, while having ionic interaction with N+ in the surfactant residing at the surface of Cloisite 30B or Cloisite 15A. On the other hand, since there are no functional groups on the surface of MMT, the absorbance band of asymmetric stretching of carboxylate groups on a modified starch did not shift along the spectra of the (AS-B)/EVOH/MMT nanocomposite, because there was no ionic interaction present.
The XRD patterns and TEM images indicated that both (AS-B)/EVOH/Cloisite 30B and (AS-B)/EVOH/Cloisite 15A nanocomposites have a high degree of dispersion of organoclay aggregates. We ascribed this observation to the presence of the ionic interaction between the positively charged N+ residing at the surface of organoclay, Cloisite 30B or Cloisite 15A, and the negatively charged carboxylate groups attached onto the main chain of a modified starch. The FTIR spectra showed that the absorbance band of carboxylate groups was shifted to a lower wavenumber, indicative of the presence of the ionic interaction occurring on the carboxylate groups. On the other hand, the (AS-B)/EVOH/MMT nanocomposite has a poor dispersion of MMT aggregates. There is no attractive interaction formed between the AS-B and MMT in the nanocomposite.
The dispersion of nanoclay (Cloisite 30B, Cloisite 15A, or MMT) aggregates in the nanocomposites based on the blends of (AS-LF)/EVOH was also characterized. It should be noted that the anionic moiety in the AS-LF also has a carboxylate group, which is the same as in the AS-B. Figure 6.8 shows XRD patterns for the nanocomposites based on the blends of (AS-LF)/EVOH. It can clearly be seen that the aggregates of clay have similar dispersion characteristics in the (AS-LF)/EVOH blend as in the (AS-B)/EVOH blend. Featureless XRD patterns for (AS-LF)/EVOH/Cloisite 30B and (AS-LF)/EVOH/ Cloisite 15A nanocomposite indicate a high degree of dispersion of organoclay aggregates in the respective blends. On the other hand, the (AS-LF)/EVOH/MMT nanocomposite has a d001 spacing of 1.4 nm, which is 0.3 nm higher than the d001 spacing of MMT (1.1 nm) (see Figure 6.1) and only 0.1 nm higher than the d001 spacing of the (AS-B)/EVOH/MMT nanocomposite (1.3 nm), given in Figure 6.4.
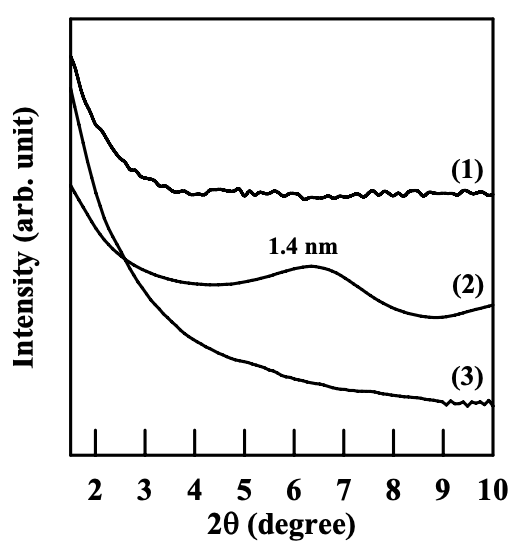
(2) (AS-LF)/EVOH/MMT nanocomposite; and (3) (AS-LF)/EVOH/Cloisite 30B
nanocomposite.
Figure 6.9 gives TEM images of the nanocomposites based on (AS-LF)/EVOH blends, and Cloisite 30B, Cloisite 15A, or MMT. It is clearly seen that both (AS-LF)/ EVOH/Cloisite 30B and AS-LF/EVOH/Cloisite 15A nanocomposites have a very high degree of dispersion of organoclay aggregates in the matrix, whereas the (AS-LF)/ EVOH/MMT nanocomposite has large clay aggregates, indicating a poor dispersion of MMT aggregates.
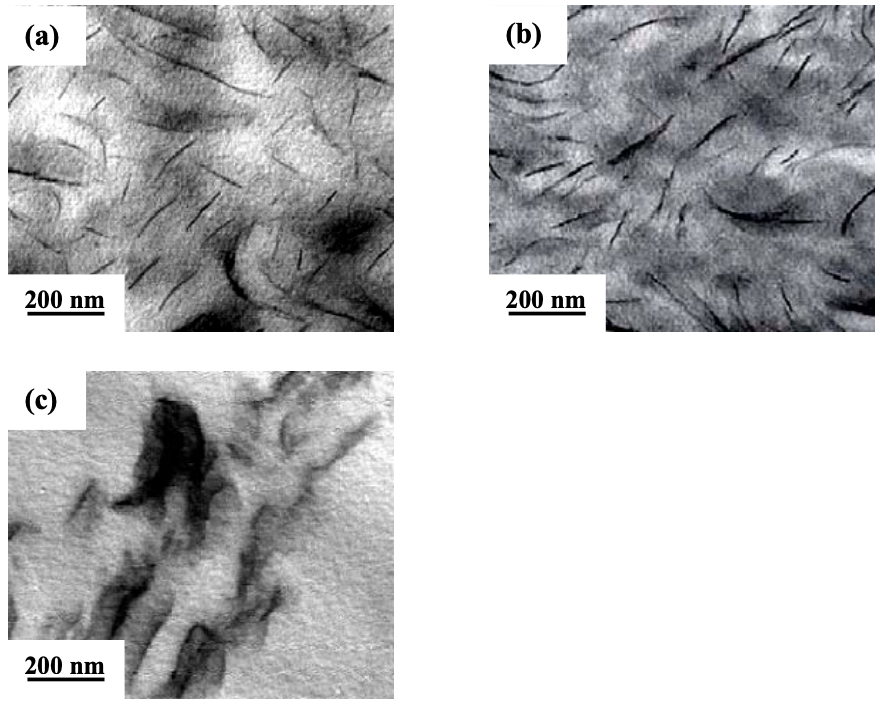
The XRD patterns and TEM images shown above suggest that organoclay aggregates (Cloisite 30B or Cloisite 15) have a high degree of dispersion in the nanocomposites based on the (AS-LF)/EVOH blend, whereas MMT aggregates have a very poor dispersion in the (AS-LF)/EVOH/MMT nanocomposite.
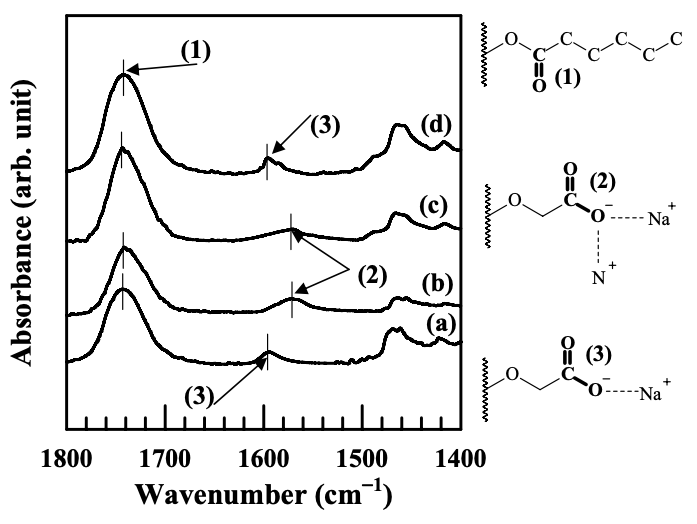
Figure 6.10 gives the FTIR spectra in carboxylate group stretching region for the nanocomposites based on the (AS-LF)/EVOH blend, and Cloisite 15A, Cloisite 30B, or MMT. The absorbance band at 1743 cm−1 was designated to the stretching of carbonyl group (C=O) in the hexanoyl group, contrasting to the absorbance band at 1737 cm−1 designated to the same carbonyl group (C=O) in the benzoyl ester group, shown in Figure 6.7. In the FTIR spectra of the (AS-LF)/EVOH blend shown in Figure 6.10, the absorbance band at 1594 cm−1 was designated to asymmetric stretching of the carboxylate group (−COO− ) in the AS-LF. Similar to that observed in Figure 6.7, the absorbance band of carboxylate group shifted to a lower wavenumber in the nanocomposites containing Cloisite 30B or Cloisite 15A with a high degree of dispersion, indicating the presence of the ionic interaction between the carboxylate groups (−COO− ) and N+ residing at the surface of Cloisite 30B or Cloisite 15A. On the other hand, the spectra of the (AS-LF)/EVOH/MMT nanocomposite show that the absorbance band of carboxylate group has not changed at all, suggesting no ionic interaction in the nanocomposite.
The dispersion characteristics of the nanoclay aggregates in the blends based on the anionically modified starch and EVOH have been characterized by XRD and TEM. It was found that the aggregates of organoclay (Cloisite 30B or Cloisite 15A) have a high degree of dispersion, whereas the aggregates of MMT have a very poor dispersion in the anionically modified starch. We ascribed the high degree of dispersion of organoclay aggregates in nanocomposites based on anionically modified starch to the presence of the ionic interaction between the negatively charged carboxylate group (−COO− ) in the modified starch and the positively charged N+ in the surfactant residing at the surface of organoclay. This ionic interaction was confirmed by FTIR spectroscopy.