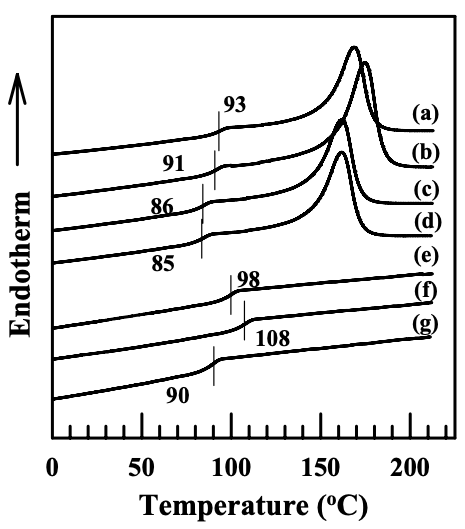
Figure 6.25 gives the DSC thermograms for the nanocomposites based on an anionically modified starch AS-B or the (AS-B)/EVOH blend. It is worth noting that in the nanocomposites containing organoclay, such as Cloisite 30B and Cloisite 15A, the glass transition temperature has increased, from 85 oC ((AS-B)/EVOH blend) to 91 oC ((AS-B)/EVOH/Cloisite 30B nanocomposite) and 93 oC ((AS-B)/EVOH/ Cloisite 15A nanocomposite), and from 90 oC (neat AS-B) to 108 oC ((AS-B)/Cloisite 30B nanocomposite) and 98 oC ((AS-B)/Cloisite 15A nanocomposite). The increase in the glass transition temperature was also observed in the nanocomposites based on neat AS-LF and the (AS-LF)/EVOH blend, and Cloisite 30B or Cloisite 15A. The values of glass transition temperatures determined from DSC thermograms are summarized in Table 6.1. For the nanocomposites containing MMT, the glass transition temperature has hardly changed. In previous sections, we have shown that the aggregates of Cloisite 15A or Cloisite 30B have a high degree of dispersion (evidenced by XRD patterns and TEM images) in the nanocomposites based on an anionically modified starch due to the ionic interaction between the negatively charged carboxylate group in a modified starch and the positively charged N+ in the surfactant residing at the surface of organoclay. On the other hand, MMT has quite poor dispersion characteristics in the matrix, because there is no strong attractive interaction formed between MMT and the matrix.
The values listed in the table above are the difference between nanocomposites and their blends or neat materials. The thermal properties of blend and neat material samples were listed in Tables 5.1 and 5.2.
In the nanocomposites based on the blends of an anionically modified starch and EVOH, the reason for the observed increase in glass transition temperature lies in the strong attractive interaction between the modified starch and silicates. However, the possibility of forming attractive interaction between EVOH and the surfactant residing at the surface of organoclay cannot be ruled out. The surfactant residing at the surface of Cloisite 30B has hydroxyl groups which can form hydrogen bonding with EVOH.
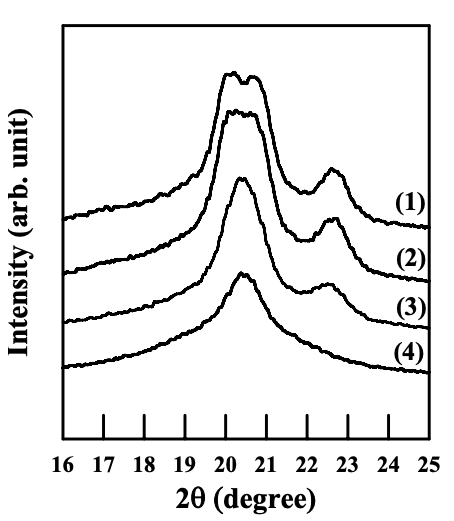
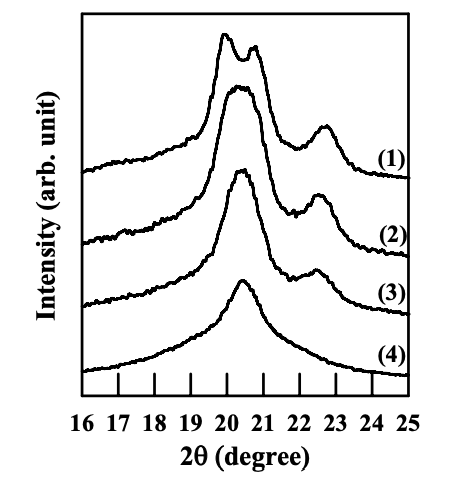
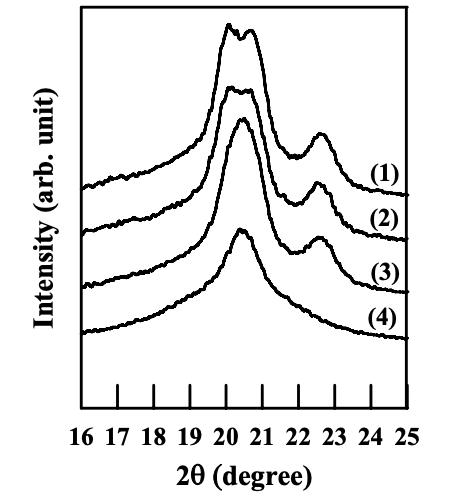
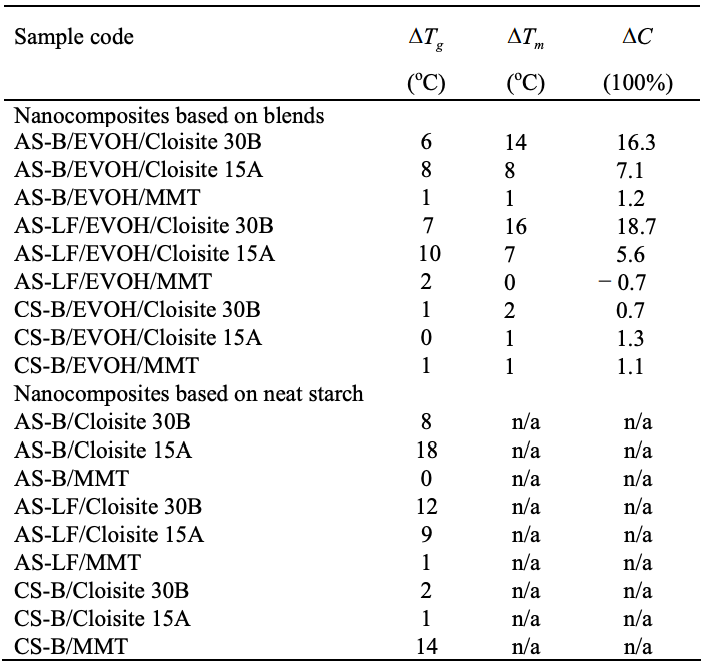
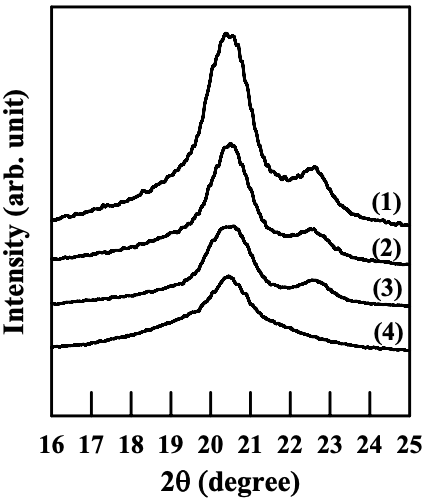
Figures 6.26 to 6.28 give WAXD patterns of the nanocomposites based on anionically modified starch (AS-B) and EVOH, and Cloisite 15A, Cloisite 30B, or MMT. Referring to Figures 6.26 and 6.28, for nanocomposites containing Cloisite 15A or MMT, the crystalline structure of EVOH in quenched samples takes orthorhombic lattice and evolves into monoclinic lattice as the crystallization temperature was increased, which is similar to that of EVOH in the blends with a modified starch. On the other hand, referring to Figure 6.27 for the WAXD patterns for the nanocomposite containing Cloisite 30B, we find that the crystalline structure of EVOH takes orthorhombic lattice in quenched samples and does not evolve into monoclinic lattice as the crystallization temperature is increased, which is different from that of EVOH in the blends with a modified starch. One should keep in mind that both Cloisite 30B and Cloisite 15A have a very high degree of dispersion characteristics in the nanocomposites based on AS-B and EVOH, whereas MMT has poor dispersion characteristics in the nanocomposite, as described in Section 6.3.
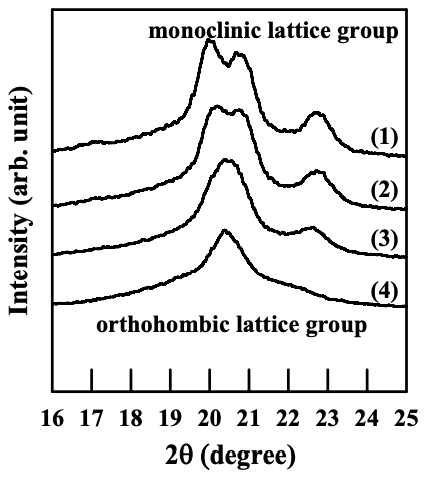
For EVOH in the nanocomposites prepared in the present study, the interaction between the hydroxyl groups in EVOH and the surfactant residing at the surface of silicate sheets of Cloisite 30B could change the vinyl alcohol content on the molecules of EVOH locally (in the vicinity of silicate sheets, but silicate sheets are exfoliated and highly dispersed all over the sample), and the crystalline structure predominantly takes orthorhombic lattice groups. Furthermore, due to the rigid nature of silicate sheets (compared with flexible polymer chains), the local change of vinyl alcohol content due to the interaction between EVOH and silicate sheets does not vary with temperature nor the hydrogen bonds between EVOH and the surfactant. That is the reason why a transformation of crystalline structure of EVOH from orthorhombic lattice into monoclinic lattice does not occur in the nanocomposite containing Cloisite 30B.
On the other hand, in the nanocomposites containing Cloisite 15A, its surfactant does not have hydroxyl groups, and there is no attractive interaction between the silicate sheets and EVOH. Thus, the crystalline structure of EVOH is quite the same as that of neat EVOH.
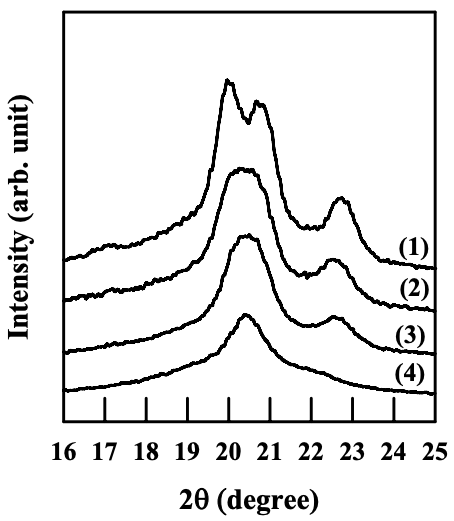
Figures 6.29 to 6.31 give WAXD patterns for the nanocomposites based on the cationically modified starch (CS-B) and EVOH, and Cloisite 15A, Cloisite 30B, or MMT. One should keep in mind that the aggregates of Cloisite 15A, Cloisite 30B, and MMT have a poor dispersion in the melt-blended nanocomposites based on the CS-B and EVOH, as described in Section 6.4. Referring to Figures 6.29 and 6.31, the nanocomposites containing Cloisite 15A or MMT have the similar crystalline structure of EVOH to that of neat EVOH under different annealing temperatures, namely, the crystalline structure of EVOH takes orthorhombic lattice in quenched sample and evolves into monoclinic lattice as the crystallization temperature is increased. Referring to Figure 6.30, the nanocomposite containing Cloisite 30B also has the similar crystalline structure of EVOH to that of neat EVOH. Although there are hydroxyl groups in the surfactant residing at the surface of Cloisite 30B aggregates, which might form hydrogen bonds with EVOH, the poor dispersion characteristics of Cloisite 30B aggregates limit the contact area between the silicate sheets and EVOH.