Brazil has established itself as a prominent player in the global tapioca starch market, leveraging its robust export capabilities and emerging import demand.
Brazil’s Tapioca Starch Exports
In 2021, Brazil proudly exported a total of $26.4 million worth of tapioca starch, securing its position as the fifth-largest exporter of this vital product worldwide.

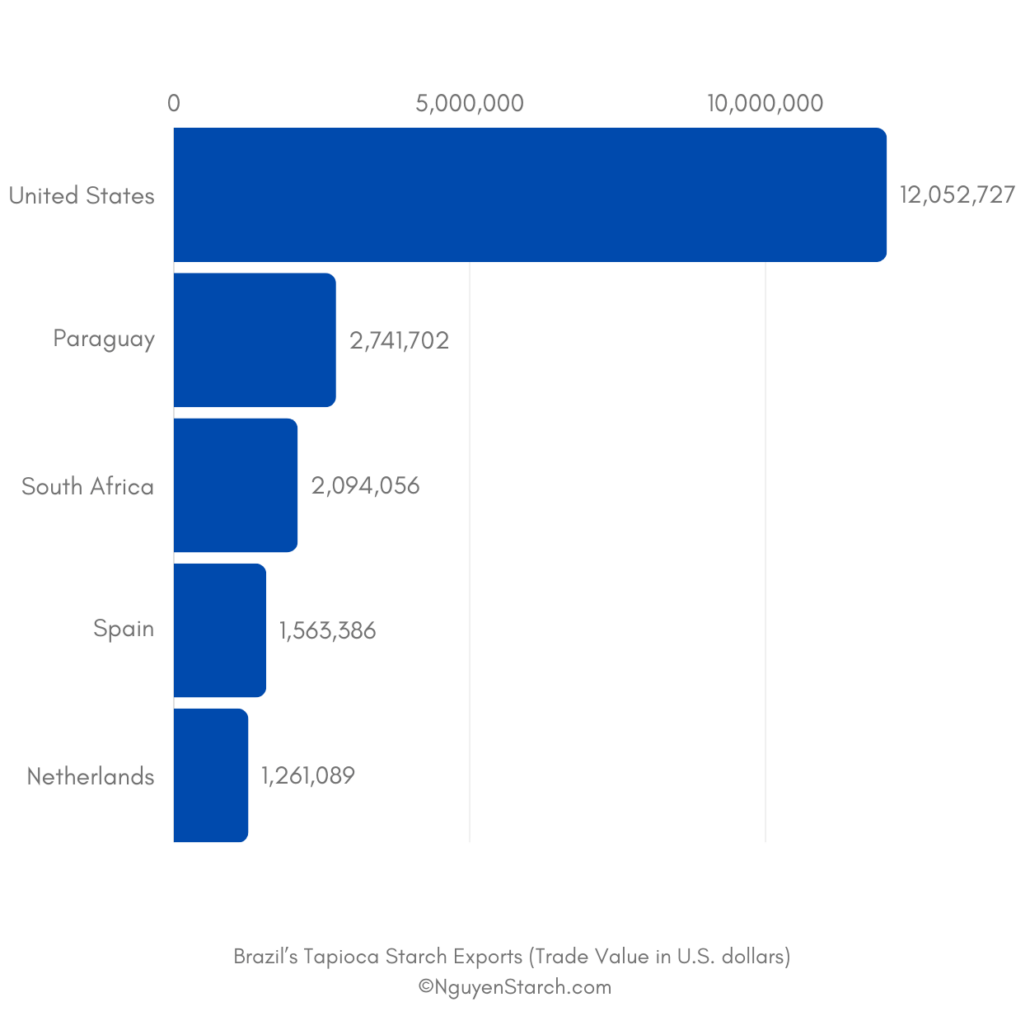
The United States emerged as the primary destination for Brazil’s tapioca starch exports in 2021, with imports amounting to an impressive $12.1 million. Paraguay and South Africa followed closely, importing $2.74 million and $2.09 million worth of tapioca starch, respectively. Spain and the Netherlands also featured prominently, importing $1.56 million and $1.26 million, respectively, from Brazil.
Brazil’s tapioca starch exports experienced substantial growth between 2020 and 2021, with the United States leading the charge with an impressive $7.88 million increase in imports. Paraguay and South Africa also demonstrated remarkable growth during this period, recording increments of $2.55 million and $1.71 million, respectively.
| Continent | Country | Trade Value |
| Africa | Angola | 2,884 |
| Africa | Central African Republic | 820 |
| Africa | Algeria | 163,070 |
| Africa | Liberia | 15 |
| Africa | Mozambique | 85,997 |
| Africa | Nigeria | 9,894 |
| Africa | Rwanda | 44 |
| Africa | Senegal | 24,000 |
| Africa | South Africa | 2,094,056 |
| Asia | United Arab Emirates | 6,898 |
| Asia | China | 38,487 |
| Asia | Hong Kong | 479 |
| Asia | India | 18,728 |
| Asia | Israel | 25,571 |
| Asia | Japan | 9,563 |
| Asia | Sri Lanka | 22,092 |
| Asia | Malaysia | 4,196 |
| Asia | Singapore | 65,978 |
| Asia | Thailand | 84,551 |
| Europe | Austria | 17 |
| Europe | Belgium | 170,410 |
| Europe | Switzerland | 23,688 |
| Europe | Czechia | 1,508 |
| Europe | Germany | 56,965 |
| Europe | Spain | 1,563,386 |
| Europe | Finland | 15,183 |
| Europe | France | 98,367 |
| Europe | United Kingdom | 446,398 |
| Europe | Ireland | 17,513 |
| Europe | Italy | 33,846 |
| Europe | Luxembourg | 7,626 |
| Europe | Netherlands | 1,261,089 |
| Europe | Poland | 859 |
| Europe | Portugal | 959,016 |
| Europe | Russia | 33,539 |
| Europe | Serbia | 177 |
| Europe | Slovakia | 2,143 |
| Europe | Sweden | 616 |
| Europe | Ukraine | 297 |
| North America | Bahamas | 13 |
| North America | Canada | 430,520 |
| North America | Dominican Republic | 77,670 |
| North America | Guatemala | 32,343 |
| North America | Mexico | 212,630 |
| North America | Panama | 78,382 |
| North America | El Salvador | 4,429 |
| North America | United States | 12,052,727 |
| Oceania | Australia | 10,192 |
| Oceania | Marshall Islands | 44 |
| Oceania | New Zealand | 977 |
| South America | Argentina | 298,784 |
| South America | Bolivia | 1,247,350 |
| South America | Chile | 432,093 |
| South America | Colombia | 681,712 |
| South America | Ecuador | 131,575 |
| South America | Guyana | 12,885 |
| South America | Peru | 57,046 |
| South America | Paraguay | 2,741,702 |
| South America | Suriname | 18,202 |
| South America | Uruguay | 177,863 |
| South America | Venezuela | 364,838 |
Brazil’s Tapioca Starch Imports
In 2021, Brazil imported $27.1 thousand worth of tapioca starch, positioning the country as the 105th largest importer of this versatile product on a global scale.
Among Brazil’s primary import sources, Austria took the lead with exports valued at $13.1 thousand. The United States and Germany also played significant roles in supplying tapioca starch, contributing $6.82 thousand and $2.05 thousand, respectively. Chile and Chinese Taipei added to the diversity of imports with exports worth $1.72 thousand and $1.68 thousand, respectively.
During the period between 2020 and 2021, Brazil witnessed noteworthy growth in tapioca starch imports, with Chile leading the charge with an impressive $1.72 thousand surge in exports. Hungary and Chinese Taipei also experienced considerable growth, boasting increments of $1.56 thousand and $1.45 thousand, respectively.
| Continent | Country | Trade Value |
| Asia | Thailand | 182 |
| Asia | Chinese Taipei | 1,683 |
| Europe | Austria | 13,068 |
| Europe | Germany | 2,053 |
| Europe | Hungary | 1,557 |
| North America | United States | 6,818 |
| South America | Chile | 1,719 |
Navigating Tariffs
As of 2017, Brazil’s average tariff rate for tapioca starch stood at 9.52%. Notably, several countries imposed higher import tariffs, with Angola, Burundi, Benin, Burkina Faso, and Botswana applying a Most Favoured Nation duty rate treatment of 10%.
Brazil’s prominent position as both an exporter and an emerging importer of tapioca starch underscores its active participation in the global marketplace. As the demand for tapioca starch continues to evolve, Brazil’s traders and policymakers will navigate the intricate trade landscape, seeking new opportunities and fostering sustainable growth in this vital industry.
Data from BACI and General Statistics Office of Vietnam
