Chromatography is one of the best techniques for the characterization of oligo- and polysaccharides. High performance liquid chromatography (HPLC) is an interesting technique for the investigation of oligosaccharides. Since its inception in the mid 1970s the number of methods and types of packing materials have expanded rapidly. Much of the earlier work on oligosaccharide analysis has been reviewed (Ben-Bassat and Grushka, 1991) and the theory, separation modes and instrumentation described (Macrae, 1982).
HPLC is a technique by which molecules in solution are separated (fractionated) according to differences in their molecular sizes, ionic properties or affinity for a column packing material. For HPLC high pressures must be used in order to permit a sufficient flow rate of the mobile phase. The separation time is an important factor in modern HPLC. The main objective is to achieve the best separation in the minimum time. The acronym HPLC can also stand for high pressure LC, but is now usually understood to mean high performance LC as the use of pressure is not the goal but merely an auxiliary means of achieving good separations (Lim, 1986).
The three main techniques used in HPLC are ion exchange chromatography (lEC), reversed phase chromatography (RPC) and affinity chromatography. IEC is one of the most important separation processes in biochemistry and other related areas, since many substances of biological origin are water-soluble ionic compounds. Bonded silicas and bonded glass with ionic groups on their surface are used in such HPLC techniques as the stationary phase separation media. Ionic solute molecules are attracted to the stationary phase ionic groups of the opposite charge and during elution the retarded substances are reversibly exchanged for ions of the same charge. Anion exchange HPLC has been recently developed and has exceptional resolving power for complex oligosaccharides. Such analyses are carried out at high pH coupled with pulsed amperometric detection (PAD), allowing separation of oligo- and polysaccharides up to DP≥50 (Koizumi, et al., 1989). The separation depends on the molecular size, sugar composition and type of linkages between the monosaccharide units.
RPC has become a widely used HPLC separation mode. In RPC the mobile phase is polar (aqueous solutions) and the stationary phase is nonpolar (organic polmers or hydrocarbon chains bonded on silica). This arrangement of the contact area for both phases is the reverse of that in both classical adsorption chromatography and ‘normal’ partition chromatography (Szepesi, 1992). The use of fully acetylated oligosaccharides overcomes problems of solubility and has resulted in the fractionation of malto-oligosaccharides up to DP30 in about 150 min using RPC (Wells and Lester, 1979).
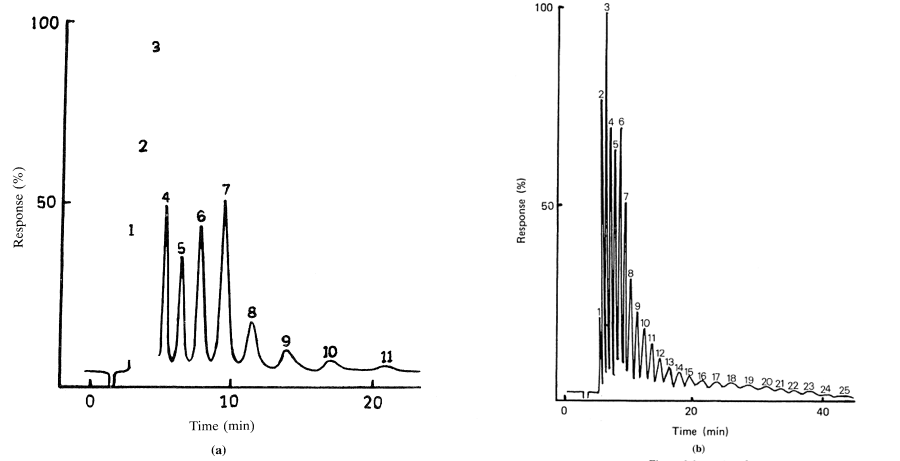
By far the most frequently used systems for the separation of oligosaccharides are those using chemically bonded phases that fractionate materials on the basis of their relative affinities for the mobile phase and the bonded phase. The most important type of columns are those containing the aminopropyl bonded phase (Schwarzenbach, 1976) which are regarded by some workers as the ultimate in column technology for oligosaccharide analysis (Folkes and Taylor, 1982). Non-polar organic solvents or an aqueous/organic mixture (such as aqueous methanol or acetonitrile) are usually used as eluent. Separation of a series of oligomers from a starch hydrolysate (such as a maltodextrin mixture) can readily be achieved with up to DP 10 being separated in 15-20 minutes using acetonitrile/water eluents containing 35-40% water (see Figures 3.2(a) and (b)). However, very high molecular weight materials cannot be analyzed due to prolonged retention times and solubility problems in the acetonitrile/water eluents. Therefore for a full analysis separation gel permeation or ion exchange is also required.
Compounds that do not interact with the column packing media are simply filtered through the interstitial volume between particles and emerge from the column in the dead volume (or void volume, V0). Solvent elution in HPLC is either isocratic elution (constant concentration of eluent) or gradient elution (predetermined variation of solvent composition during the run). Gradient elution is a must for many HPLC applications. Detection of oligosaccharides eluting from HPLC columns is the biggest challenge and the weakest link in the analytical chain. For underivatized oligosaccharides the most common detectors are refractive index (RI), UV and electrochemical detectors. Non-specific detectors such as the RI detector are used routinely (Scott and Hatina, 1988; Derler et ai., 1988). PAD detectors have been considerably developed in the last few years, coupled in particular with anion exchange (Hernandez et ai., 1990) and affinity HPLC (Wang et al., 1992). A complete study of linear and branched glucose oligomers using anion exchange HPLC and PAD has recently been performed to look at variations in detector response at different degrees of polymerization (Ammeraal et ai., 1991). A considerable amount of work outlining the chromatographic characterization of starch oligosaccharides has been published previously (Heyraud and Rinaudo, 1991).
Gel permeation chromatography (GPC), or size exclusion chromatography (SEC) as it is sometimes known, is the most frequently applied method in this area, and is a technique by which molecules in solution are separated (fractioned) according to differences in their molecular sizes (or more specifically their hydrodynamic volume) as they pass through a column packed with one of the many chromatographic media available (in this case a gel) (Hunt and Holding, 1989). A gel is a heterogeneous phase system in which a continuous liquid phase, normally aqueous in nature, is contained within the pores of a continuous solid phase, the gel matrix. The pores have a specifically controlled range of sizes and the matrix is chosen for its chemical and physical stability and inertness (lack of adsorptive properties). Gels may be formed from polymers by cross-linking to form a three-dimensional network; for example ‘BioGel’ is formed by crosslinking polyacrylamide and ‘Sephadex’ by crosslinking dextran.
The pores in the gel matrix which are filled with the liquid phase are usually comparable in size to the molecules of interest for separation. In a gel filtration column gel particles in bead form are packed to form a separation bed through which a buffer solution, the eluent, is passed. Sample molecules which are to be separated are added as a zone to the top of the bed. The sample zone moves down the bed as eluent is added to the top. The small molecules which diffuse into the gel beads are delayed in their progress down the column compared with the large molecules which cannot diffuse into the gel and move continuously down the column in the flowing eluent (and are said to be excluded, since their size is greater than the exclusion limit of the gel). The large molecules thus leave the column first followed by the smaller molecules in order of their sizes. The eluent is usually a buffer solution with a well defined pH and ionic composition chosen to preserve the structure and biological activity of the substances of interest.
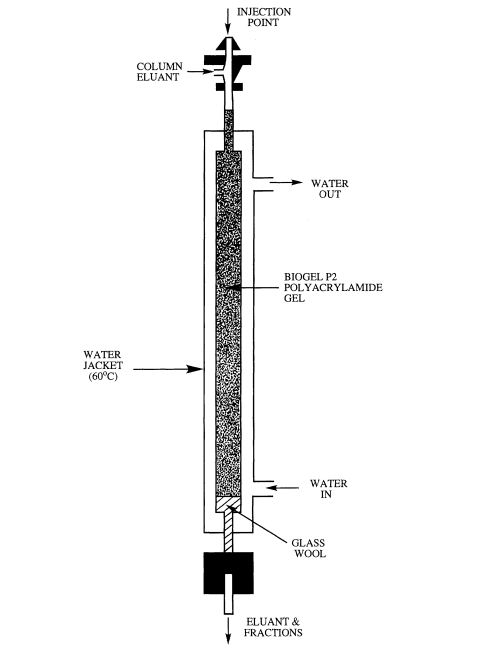
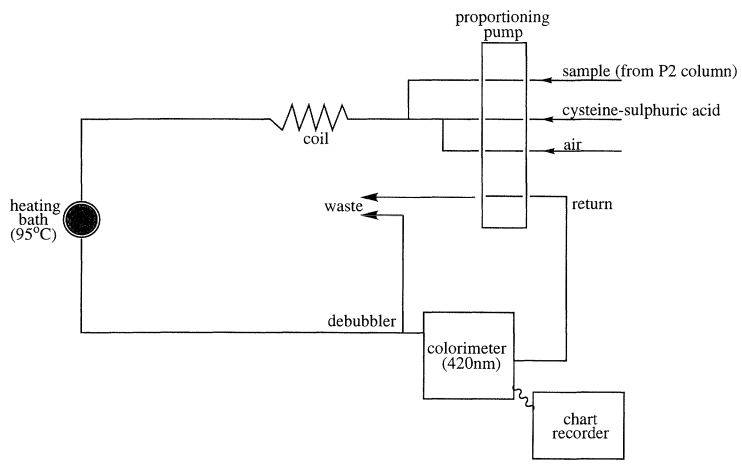
GPC has occupied a key position in the purification of thousands of enzymes (Chaplin and Bucke, 1990), polysaccharides (Kennedy and White, 1983), proteins (Simpson, 1993) and other biological macromolecules. It is particularly useful in the separation of many different carbohydrates, and using BioGel P2 polyacrylamide gel as the separation media mono- and oligosaccharides can be successfully separated, the exclusion limit of the gel being 2000. The gel permeation chromatography of maltodextrins has been investigated and BioGel P2 has been shown to give a good separation based on the hydrodynamic volume of the carbohydrate, provided that column temperature is maintained constant at greater than 65°C to suppress the loose adsorption that exists on this polyacrylamide based matrix (see Figure 3.3 for column set up). When linked to an automated on-line cysteine-sulphuric acid assay system (Figure 3.4) to monitor the total carbohydrate content of the material coming off the column (Barker et al., 1968), maltodextrin samples can be analyzed routinely to give information on their molecular weight distribution in terms of the degree of polymerization (Figures 3.5(a) and (b)). Peak areas can easily be quantified to give the percentage of each oligomer in the total material (Table 3.2).
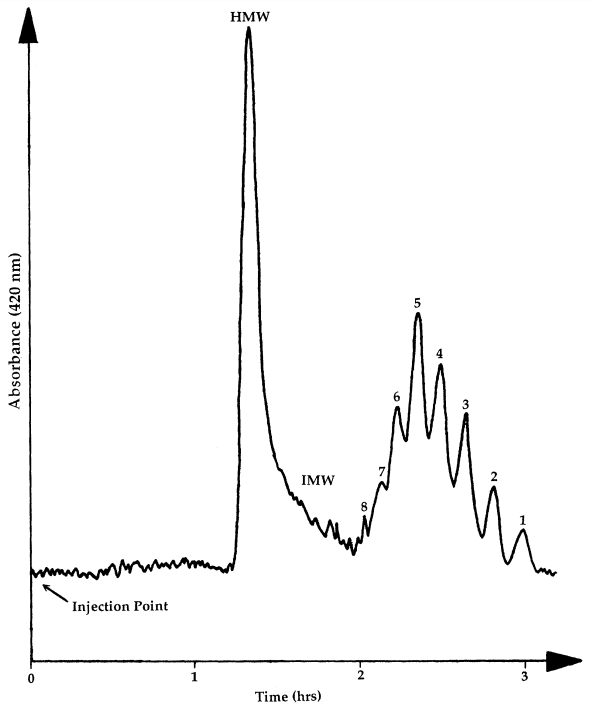
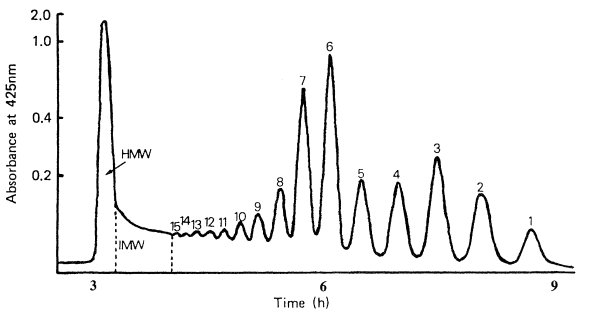
| Peak | Area (%) |
| DP1 | 0.6 |
| DP2 | 2.4 |
| DP3 | 4.0 |
| DP4 | 8.6 |
| DP5 | 11.1 |
| DP6 | 12.3 |
| DP7 | 8.4 |
| DP8 | 3.7 |
| IMW | 15.3 |
| HMW | 33.6 |